How BI Modernisation Calls for Embedded Analytics to Improve UX and DX
Business intelligence (BI) is at the heart of modern enterprise. We rely on data to understand every aspect of our business—from our own operations to how our products and services meet our customers’ changing needs—and to develop products and services we sell to those customers.
With modern BI tools and strategies, we can enhance not only the user experience (UX) but also the developer experience (DX), speeding up our decision-making to help us meet market demands and build a competitive advantage. When data’s reliable, readable and readily available, we can make good decisions, faster.
In this blog, we’re going to look at embedded analytics in BI Modernisation—what it means, why it matters and who it impacts. We’ll also explain how adding a semantic layer helps developers improve the look and feel of analytics tools to drive delightful user experiences.
What is Embedded Analytics?
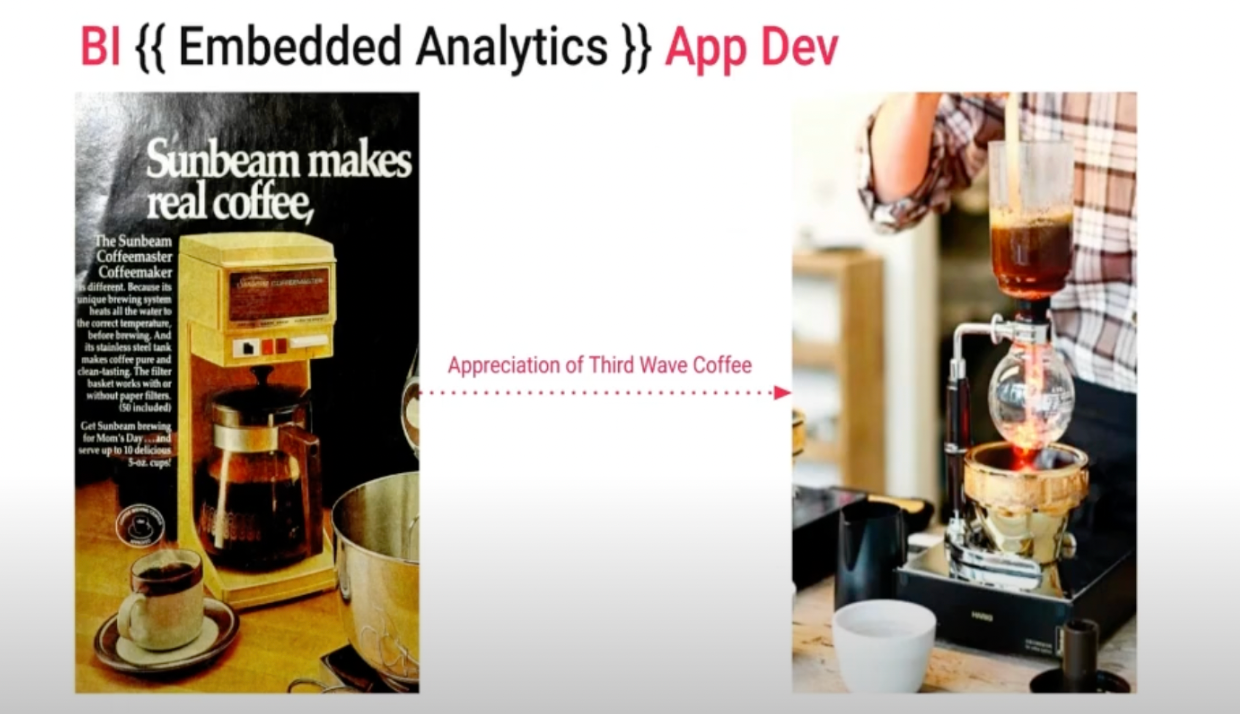
If web development and traditional BI had a baby, it would be embedded analytics. Embedded analytics is the integration into a customised web application of the dashboards, reports and metrics that your organisation needs to make informed, data-driven decisions. It helps improve UX and accessibility, and while that might not sound like BI for some readers, it’s very much part of the evolution of BI tools. To explain this, I like to use the analogy of third-wave coffee.
The Coffee Analogy
From a functional morning kickstart to an immersive experience built on flavour profiles, tradition and specially designed receptacles, coffee is no longer just a stimulating drink.
On the one side, you have drip coffee. Something quite basic that you’d find at a diner. You pour it into the mug and it's a little bit grey, a little bland—it's very utilitarian. It serves a specific purpose and it's not necessarily very dynamic. If you’re ordering coffee in a diner, you’re not going to ask the server about the beans or how they roasted it. And you certainly wouldn’t ask for a cold-brew.
On the other hand, you have what would be referred to as third-wave coffee, which is a little bit more involved in terms of the production of the coffee. There's a lot more thought into where you source the beans and how you go about roasting them as well as impact on the environment and the sustainability of the supply chain. This isn’t just coffee to satisfy a caffeine craving; there’s art and science behind it, so it’s more like a celebration of the coffee.
In this analogy, coffee is your data and the cup o'grey is your fond memories of MicroStrategy.
Today, modern BI isn’t just about getting the basic figures. Like third-wave coffee it’s a bit more involved—there's an appreciation for UX as well as DX. Traditionally BI tools have underdelivered when it comes to not only look and feel but the overall experience. They’ve been limited by data modelling techniques ill-suited for big data, with over-emphasis on ‘democratising’ data without proper data literacy, and a lack of support for custom web applications. These limitations risk the quality of data, the attention of end-users, and ultimately, the speed of decisions.
The Three Waves of Business Intelligence
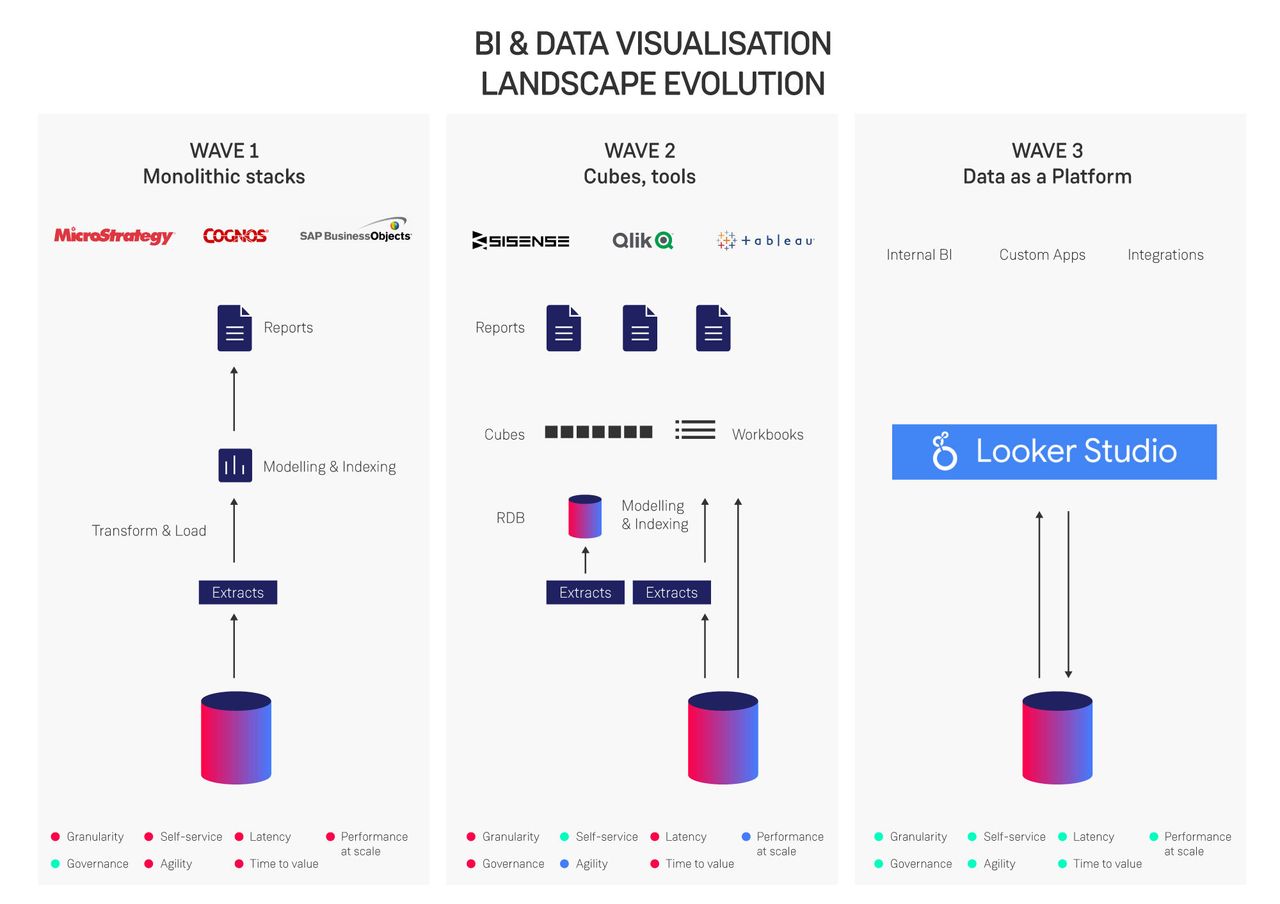
There are three waves of BI tools that have evolved over the last few decades. While it is a slight oversimplification, the three waves can be summarised as follows.
Wave One
- Extract: manually from raw sources
- Model: lightweight, ad-hoc modelling in an uncontrolled environment
- Visualise: rigidly model metrics and dimensions to suit the BI tool of choice
- Deploy: into a loosely controlled BI application
Wave Two
- Extract: data from one staging environment into another such as a data warehouse to a workbook or cube
- Model: normalised data in tables via a presentation layer in the data warehouse
- Visualise: in a ‘democratised’ platform that emphasises end-user data visualisations but risks high-level of data abuse
- Deploy: into an RBAC controlled BI application that may not govern access to data
Wave Three
- Extract: data via a seamless pipeline consisting of modern analytics data warehouse like Snowflake or BigQuery
- Model: via a semantic layer that dynamically creates SQL, fetches from a de-normalised or normalised source, and caches in a fast-access data layer
- Visualise: on top of metrics and dimensions that are more finely and dynamically controlled from data warehouse to visualisation, emphasising trust in data quality
- Deploy: into an RBAC controlled BI application definitely governs access to data while also allowing ease of integration with custom web applications
Wave Three is where we see embedded analytics and the semantic layer start to play a role in modernising BI. The value of this evolution, however, does differ depending on what persona is being considered.
Wave Three Benefits by Persona
There are usually three key user groups involved in building modern BI solutions: the product owner, the application developer and BI developer. Each role will have a different take on what is valuable from Wave Three.
1. The Product Owner
The product owner will be looking to delight their customer—internal enterprise customer or external commercial customer. From that perspective, enabling embedded analytics becomes very attractive, as a means to truly customise the look and feel of their data application. They're going to expect a high-gloss, high-polish finish to reports, insights and data presented to their customer.
We’ve mentioned modern analytics warehouses above. One aspective of these tools is data governance through RBAC, which is an incredibly useful concept when you have hundreds, or hundreds of thousands of customers. Look and feel isn’t merely about design but the overall UX of a customer—from access to billing. RBAC makes this easier for the product team as well as the customer.
2. The Application Developer
The application developer will be more intimately involved in the build and therefore implementation of embedded analytics. They might be more acutely aware of the gap between embedded analytics and where the data resides. They’ll need to manage and develop the middle layer that sits between the data and the application, so they will appreciate the pain or ease involved in accessing and rendering data in a performant manner.
With the introduction of a semantic layer, some software best practices become much easier. For example, in the semantic layers of Looker and dbt, data and business logic can be version controlled and tested. Also, as is the case with Looker, there is the exceptionally convenient Looker Extension SDK, which effectively provides that middle layer out of the box, improving the DX of embedded analytics for the application developer.
3. The BI Developer
The BI developer will need a lot more freedom in developing custom visualisations—particularly given the high-polish finish desired by the product owner. Moreover, the enhanced ability to be creative or flexible with visualisations will help articulate the data’s story—especially when it’s a complex story—and only serves to empower this persona and reach desirable outcomes.
Each BI tool has its own native visualisations, some are better than others, which is why you see Looker support for Tableau as well as OSS visualisation libraries such as D3. At Contino we have developed D3 charts for our own customer internal report needs, which allow us to more effectively articulate insights.
Should Embedded Analytics be the Default?
In short: Yes! If you want excellent UX, which is increasingly what users expect, then embedded analytics should be your default position. Your dating app has an excellent UX and so does your expense app, so why shouldn’t your enterprise app? This poor UX leads to frustration and ultimately a loss of attention on the part of your customer.
That’s not to say this story is all sunshine and rainbows. Embedded analytics as a form of BI modernisation is more complex than traditional BI, so there is a cost benefit analysis to be made. However, it’s worth knowing that embedded analytics has never been easier.
Make sure to sign my upcoming talk, Embedded Analytics: The Modernisation of BI—Dec 12 2022, 11:00am GMT. In this talk, Simon Darr and I will speak about building data applications at speed that also deliver improved user experiences through embedded analytics. Simon will also provide a Looker demo, and explain why this is an enormously powerful chassie to deliver beautiful visualisations and impactful insights.


