Operational Resilience Dashboard for Financial Services: Lower Your Risk and Become More Resilient [Free Tool]
YOU CAN DOWNLOAD OUR OPERATIONAL RESILIENCE DASHBOARD HERE.
Operational resilience—being able to adjust and pivot to keep going in a storm—makes up more and more of the work we do at Contino.
And there’s no escaping it in systemically important industries like financial services.
Governments, regulators and demanding customers are all intensely interested in your ability to stay operational during times of crisis.
And perhaps your shareholders and employees are as well!
In short: there’s no escaping operational resilience as a central plank of any enterprise business model.
In this blog I’ll introduce our new tool for mapping operational resilience in financial services, how to use it and explain why it’s so important to map your operational resilience.
The Operational Resilience Dashboard
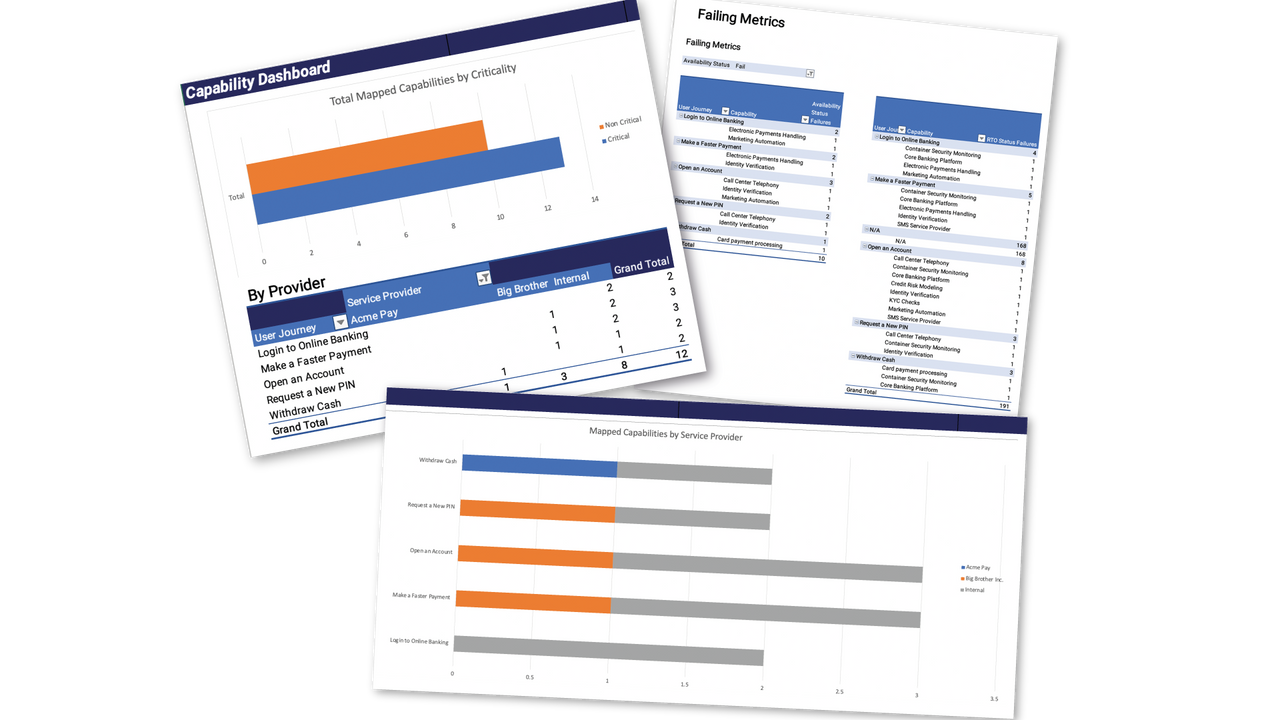
I worked with our consultants and data team to build what we call the Operational Resilience Dashboard.
You can download the dashboard here. (Psst it'll start downloading straight away!)
What it does: the dashboard helps financial institutions to understand, at a high-level, their operational resilience across critical business service lines (e.g. making a payment, opening an account, onboarding new customer).
In essence, you will have a much clearer idea of your risk posture across the key business services you provide.
It can be applied to quickly identify potential risks across your architecture or where investments may be required to match regulatory requirements or the demands of customers.
How it works: the dashboard allows you to map business service lines to the levels of risk in the technology components that underpin them.
You can then cross-reference the risk inherent in these components against your own target objectives, whether these are SLAs, SLOs, Recovery Time Objectives or Recovery Point Objectives.
You can identify when the RTO, RPO, SLAs and SLOs of business service lines technology stack sit outside of your organisation's risk appetite.
To populate the Operational Risk Dashboard, you may need to review the following types of documents:
- Architecture specifications and designs
- Metrics and reporting dashboards
- Third party contracts and supplier agreements
- Customer journey maps and flows
- Service management processes and incident standards
- Risk agreements and registers
There are a couple of “gotchas” we should touch on:
- Multiple business service lines: A single technology component may map across multiple business service lines so we also wanted to demonstrate where this occurs across the technology estate.
- Critical or non-critical?: A single technology component may map across multiple business service lines but could either be deemed to be “critical” or “non-critical” to the operating functionality of different business service lines.
In layman's terms, we deemed “critical” systems as those that are essential to a customer journey in being fully executed. Whilst “non-critical” systems are deemed to be systems that are not essential to customer journey’s in being executed end to end. Some may say that is a gross oversimplification of the retail banking estate. However, it’s important to establish a reporting baseline and understand what the organisation has in place and we felt this was a valid starting point.
In all, we wanted to pool this information into a single view that could be gathered over the course of a short 4-6 week period for our customers. Whilst creating a consolidated position where risks could be acknowledged and either accepted, mitigated or treated with the required intervention. This allows financial institutions to formulate a remediation plan across people, process and technology which by the large can be addressed with incremental changes so long as the compounded risks are understood, tracked and reported on at an agreed frequency.
Why the Operational Resilience Dashboard Is Needed
The challenge is that retail banks technology estate is too complicated to properly understand the level of risk. Mergers and acquisitions, bolt-on legacy systems and key engineers retiring or leaving add up over the years.
If you don’t know what risks you face, you can’t remediate those risks.
And you’re only as strong as the lowest common denominator in your tech stack!
I really empathise with the people tasked with figuring out their organisation’s risk posture. It’s insanely challenging!
Let’s dive into an example of this complexity. An average retail bank’s architecture hangs together across five core products:
- Current Accounts
- Savings Accounts
- Mortgages
- Credit Cards
- Loans
Underpinning each of these core products are around 20-25 critical business service lines that need to be available for bank to operate 24/7/365.
These Business Service Lines are typically divided into four service tiers or categories: platinum (mission critical that carries the highest SLAs), then in descending order of importance gold, silver and bronze.
And then these Business Service Lines are broken out across multiple channels: branches, telephony, web, mobile.
All these systems are hosted across a mix of on-premises, public cloud and managed service providers through third- and even fourth-party suppliers.
Five products, each with 25 business services, across four service tiers, broken into multiple channels each hosted on a complex patchwork of platforms and systems.!
It’s no surprise that some organisations struggle to understand how all these technology components hang together!
Delving Deeper into the Problem: A Practical Example
Imagine you have a Faster Payments Service that consists of 35 technology components and has an SLA of 99.99%.
If all of these services are architected using a multiple Availability Zone model in the public cloud then you should have an availability of 99.99%.
However, let’s assume that one critical technology component has only been architected across a single Availability Zone. All of a sudden you have lower availability.
Maybe this is acceptable. But maybe not! It depends on the criticality of the service in question. Either way: you need to know what risks you are exposing yourself to!
Closing Thoughts
As a final reminder you can download the solution from here.
It might take some deciphering from someone consuming the framework cold. As such, we are happy to jump on a call with anybody that has queries around how to apply it in their landscape!


