How to Turn Your Customer Insights Into Business Value With Advanced Data Analytics
Over the last few decades, businesses have collected plenty of valuable customer data. However, the full potential of these datasets is not always realised.
When the data is stored on-premise, in siloed systems and without offering a single source of truth, it can be cumbersome and time-consuming to locate and validate the latest datasets, resulting in questionable reporting accuracy.
At the dawn of a new competitive era built upon an open data economy–with open banking and open energy gaining traction and telecommunications soon to follow–it is more critical than ever for organisations to understand and anticipate consumer behaviour using the power of predictive analytics, and to use these to create personalised solutions.
Needless to say, understanding your customers’ needs results in a vastly superior customer experience which boosts customer retention and ultimately generates business value.
However, before organisations can begin to turn the insights from their customer data into real business value, they first need greater agility when it comes to accessing and analysing customer data.
This means moving away from disparate and departmental reporting in favour of interactive dashboards to collect, analyse and visualise insights and a single-view customer representation to quickly interpret a customer’s history i.e. past complaints, transaction records, churn risk history, etc.. All of which enables customers’ needs to be met proactively and quickly.
In this blog, we'll share practical steps to unlock the value in your data, including the different techniques for analysing and consuming your data as well as their benefits.
What Data Do You Need to Get Started?
The first thing you’ll need is (drumroll please...): Data.
A lack of data is rarely a problem these days. The challenge is more around how to tap into the potential of unused data, and ensuring that data quality meets the reporting standards.
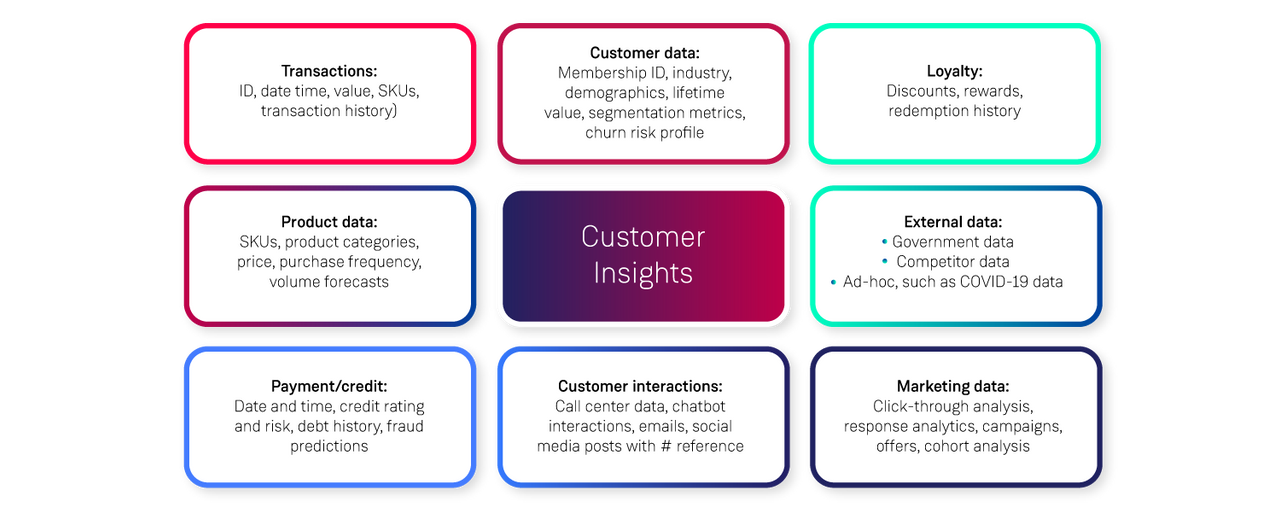
Examples of possible data sources are summarized in Fig. 1 below. However, the availability of these datasets will depend on the industry, the business needs and the intended use of your customer insights.
Is the main goal to increase customer retention? Is it to tailor solutions to individual, personal needs? Is it to increase customer satisfaction by providing better customer experience?
The goal has to come from the business based on pre-defined strategy. Once the vision is clearly outlined, data scientists and analysts can help figure out the best ways to utilise the available datasets to achieve the desired outcome.
Fig. 1 - Possible datasets for customer insights
Where Do You Get Your Data From?
Examples of possible data sources
Customer data:
- e.g. Membership ID, industry, business location, etc.
- Useful for: personalisation strategies and painting a detailed picture of customer demographics. It’s important to note that you must follow regulatory requirements and make sure that access to PII is restricted, as dealing with sensitive, personal data raises ethical questions and has legal consequences if misused.
Transactions data:
- e.g. How often customers make purchases, their preferred products, the value of their purchases, how long ago they made their last purchase.
- Useful for: providing information about the spending habits of customers and is useful for predicting future behaviour and analysing past habits.
Product data:
- Determines how valuable a product/customer is and gives insights on what products/services customers are purchasing.
- Useful for: informing marketing strategy, and providing a better understanding of customer preferences.
Payment/Credit data:
- Measures a customer’s reliability of meeting their payment obligations, measuring their credit worthiness. Is the customer hitting credit limits?
- Useful for: making critical financial decisions, such as who should receive a loan, and can also help to uncover customer fraud.
Customer interactions:
- Either raw text of interactions (service requests, reviews) and/or a label/category of the interaction.
- Useful for: performing sentiment analysis and for real-time analysis of raised issues in order to inform the business on how to best address customer needs.
Marketing data:
- To understand preference towards a certain online feature/product and measure the engagement level of customers.
- Useful for: testing marketing campaigns, choosing the right products and ads.
Loyalty data:
- e.g. Is the customer engaging with discounted offers/collecting rewards?
- Useful for: narrowing down customer segments where certain marketing strategies are effective. Additionally, engagement level is usually a good indicator of customer loyalty, i.e., the more engaged customers are, the stickier they become.
You could also utilise external data sources, such as:
- Government data: can be incorporated where appropriate. This can give a view on the socio-economic status of customers or regions, general demographics, e.g. Census.
- Competitor data: can be used to better identify when customers are leaving to obtain superior counter-offers.
- Ad-hoc datasets: e.g. bushfire relief, information on Covid-19 (stage 1, stage 2, lockdown); number of cases can be overlaid to understand the effect of the pandemic on churn rates, contact tracing etc.
How to Analyse Your Data
The next step is to bring these disparate data sources together by combining them through ETL (extract, transform, load) pipelines. By automating this step, you can make sure that the required quality controls are in place when it comes to cleaning and aggregating the data, before it can be made available for analytics purposes.
When it comes to actually analysing your data, there are many techniques to consider. I’ve outlined four of the most popular analytics techniques below.
4 Useful Analytics Techniques
1. Customer/Product segmentation using clustering techniques
The aim of clustering is to divide customers into groups that reflect similarities. The advantage compared to traditional segmentation techniques is that clustering algorithms can be applied to large volumes of data consisting of several variables (age, demography, subscription plan, transaction frequency etc.). They are also simple to train and even work on unlabelled datasets.
Popular techniques include K-means clustering, hierarchical clustering, DBSCAN, etc., and other tools such as t-SNE can be used for a 2D or 3D representation for visual consumption.
The value of segmentation is realised by the identification of the most valuable customer/product groups, allowing the business to pinpoint growth opportunities and resulting in better targeted sales and marketing operations. Understanding how different customers behave and what their spending habits and product preferences are can be easily translated into up-selling and cross-selling opportunities.
For example:
- A bank can categorise their customers based on life stage (just graduated, living in the suburbs and ready to build a family, etc.) and corresponding financial stability, analyse what demographics they belong to and develop products suitable for certain age groups etc.
- A retail provider can segment customers based on their spending habits to understand who the regular/infrequent customers are, as well as their digital behaviour and their preferred channel of interaction.
2. Churn risk modelling using predictive analytics
Customer churn refers to customers quitting or cancelling a service. Supervised machine learning techniques using algorithms such as logistic regression, XGBoost, etc., can be used to predict the churn category or churn probability for customers based on input data. This way, customers can be divided into low/medium/high churn risk buckets and treated accordingly. Low risk customers are the most loyal ones, whereas medium-to-high risk customers require more attention.
Identifying high churn risk customers allows businesses to be proactive in their retention efforts, creating on-going value through the customers who would have left without intervention. It also leads to substantial cost-savings by creating visibility into where marketing operations should be targeted, for example which customers need immediate attention and which ones deserve praise for their loyalty.
For example:
- A utility provider can build a churn prediction model based on the energy consumption history of a customer, the type of property they have, type of customer (industrial vs. private), etc.
- For irregular customers in the retail sector, time since last purchase is usually the lead indicator for churn.
3. Sentiment analysis
Natural language processing techniques, such as sentiment analysis, can be used to interpret customer feedback, and more importantly, the sentiment behind it.
Sentiment analysis is a natural language processing technique for categorising text data based on sentiment, i.e., positive/negative/neutral. Tools such as AWS Comprehend make it easy for developers to implement this technique for customer surveys, reviews, social media comments, etc.
This technique can be applied to text data of various origins (chatbots, emails, social media, etc.) to understand general feedback toward a product or service. It is particularly powerful when applied in a real-time fashion (analysing an incoming call) but it can be just as useful when used for building out the timeline of customer sentiment history–understanding if customers change their perception and sentiment over time.
For example:
- When it comes to open banking and open energy, sentiment analysis can be applied to understand what products and offers customers consider attractive, and what the deal breakers are. The open economy opens up opportunities for creating innovative solutions by combining services, providers, and offering competitive deals to satisfy demand. Sentiment analysis and other natural language processing techniques applied to customer feedback data will be valuable assets in understanding customer adoption of these new ideas and digital experiences.
4. Cohort analysis
This technique is effective for tracking how customers that were acquired at the same time (cohorts) change their behaviour over time. For example, how do the churn rates of January vs. July cohorts change over the period of one year? Is one cohort stickier than the other?
Cohort analysis relies on calculating representation (number or percentage of customers) as a function of time, relative to the starting cohort. Heat maps are a great way to visualise this change and highlight rapidly evolving groups.
This technique is useful for comparing the success of marketing campaigns, different sales and communication channels, and can even be applied to simpler metrics (e.g. demographics), such as tracking engagement over time in different states of the country.
For example:
- Utility providers can apply cohort analysis to compare the effects certain events have on different energy plans.
- A retailer can measure to what extent different marketing campaigns lead to customer conversion.
So which technique should you use?
These are just a few of the more popular techniques but, of course, this is not an exhaustive list by any means. Implementing one or two methods that are relevant for a certain use case can already make a difference in producing valuable insights and driving cost savings, but they become even more powerful when the outcomes are combined.
For example, you can look at the churn rate across various customer segments to understand if certain customer traits can be interpreted as lead indicators of churn. Is negative sentiment a good predictor for churn?
Finally, it is also important to have a centralised location for collecting and viewing this information for quick accessibility.
How to Consume Your Insights
What do you do with your data once you’ve analysed it?
Interactive dashboards, (Power BI, AWS Quicksight, plotly dash, etc.) are very efficient in displaying data in the form of charts, tables, and can be used for reporting on general KPI-s.
The Advantages of Interactive Dashboards:
Dashboards can serve as a single source of truth, making it easier to retrieve metrics, without the need to browse through spreadsheets and perform calculations every time a question arises.
- For example: With a dashboard solution, the following metrics can be easily monitored and retrieved in real time: How many customers are in a certain group? What is the monetary value associated with these customers? What is the yearly retention rate? How do the metrics perform over time? Is the business losing customers?
Besides simple metrics and global indicators of business performance, dashboards can be used to drill down and view customer insights on an individual level. Visualising the timeline of past interactions, credit or payment history, churn risk evolution etc. creates a single view of the customer and provides clarity when trying to understand present behaviour. You can get a view into how the customer is performing compared to similar segments or to the overall customer pool. Such dashboards deliver the most value when created with having the user’s specific needs in mind.
- For example: Marketing can use a customer dashboard to manage and track different campaigns, compare the performance of test and control groups over certain periods of time. A dashboard in this case would need to incorporate features that help understand customers on a more intimate level, and know how to tailor solutions to their needs.
Relevant data can be retrieved in near real-time, allowing for strategic intelligence/decision making.
- For example: Real-time anomaly detection, such as detecting outages based on IoT devices and data streams. Once an anomaly is confirmed, customers can be informed and reassured in a proactive manner.
The Benefits: Turn Your Customer Insights Into Business Value
There are a number of ways that customer insights, through dashboard solutions, can drive value for your organisation. These were touched upon already and are summarised here.
Enable real-time customer insights to frontline staff
Drive engaging and personalised customer experiences with every interaction. Through real-time visibility into customer insights such as previous sentiment, churn risk, product preferences and transaction history, customer service operations can make more informed decisions when interacting with customers increasing customer satisfaction.
Energy Central reports that a significant number, 72% of customers expect customer service representatives (CSR) to be informed on their product and service history when they contact the provider. Under such circumstances, CSR-s only have a few seconds to solve a customer’s issue.
Increase customer growth opportunities
Increase customer growth opportunities by understanding customer needs and creating highly personalised solutions to satisfy individual customer needs. Understanding customer sentiment towards a product or service, supporting customers by quick issue resolution and identifying the next best action thanks to real-time analytics.
In a recent survey, EY outlined how during the accelerated digital transformation induced by the COVID-19 pandemic, personalised solutions that are able to satisfy customer needs can be a real differentiator for financial institutions. Real-time, data-driven insights, underpinned by solid architectural design allow businesses to continually adapt and evolve, and respond to customer needs.
Protect existing revenue and increase customer lifetime value (CLV)
Put preventive churn measures into place and proactively engage "at risk" customers. Customer acquisition is pointless without customer commitment and long-term lifetime value.
In the Qualtrics Banking Report, 550 banking customers were interviewed, where 56% reported their banks made no effort to keep them when they announced they were churning.
Decrease acquisition costs
Lower costs by creating more personalised solutions, instead of targeting the entire customer base with campaigns that do not apply to certain audiences. Understand customers on an individual level, and offer the right solutions.
McKinsey talks about personalisation in the context of disruption, and points out how retailers can use personalized marketing to drive growth and reduce acquisition cost. “Leading retailers create a 360-degree view of their customers—where they shop (online or in-store), what they shop for, when they shop, how much they spend, what they view or click on—and target them with highly personalized offers based on that data. These retailers use personalization engines powered by machine learning to improve e-commerce websites and their marketing campaigns across channels. “
And finally...
As a final remark it is important to note, if the data maturity of the business is low and analytic solutions are new to the business, upskilling employees will likely be a necessary step in the adoption process. In alignment with the strategy and vision of the company, dashboards and analytic solutions should be introduced to solve business problems. Without this alignment, the adoption of ML solutions will be limited and untrusted.
Are you ready to transform your business and turn your data into insights?
Get in touch!


